GraphPad InStat - Conquers the learning curve by escorting you through statistical analyses. #Statistical analysis #Analysis checklist #Learning curve #Statistical #Analysis #Checklist
Most statistics programs are designed by statisticians, for statisticians. These programs are feature-packed and powerful, but can overwhelm scientists with thick manuals, obscure statistical jargon and high prices. GraphPad InStat is different. InStat is designed by a scientist for scientists.
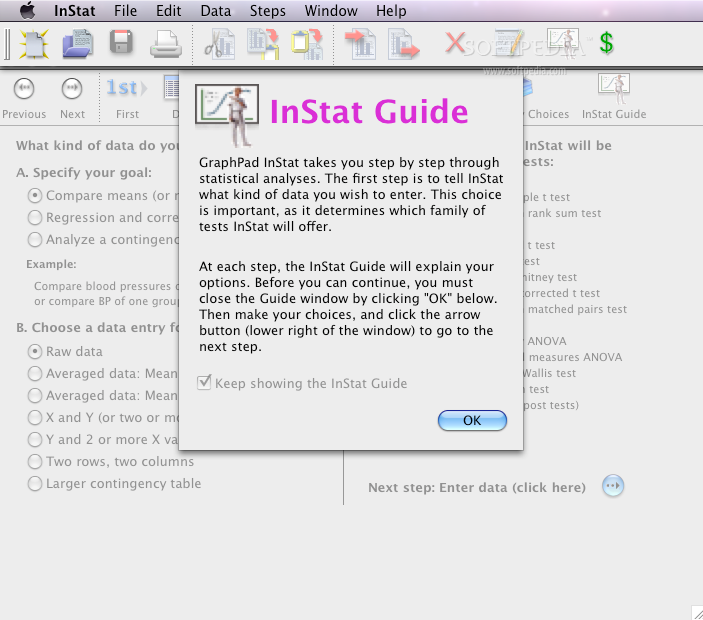
InStat conquers the learning curve by escorting you through statistical analyses. You'll master the program in just a few minutes � really.
You don't have to know the name of the test you need. InStat helps you pick an appropriate test by asking questions about your data. If you are unsure, consult the extensive help screens, which explain the statistical reasoning in plain language.
InStat does not assume that you are a statistics whiz. It presents results in simple paragraphs, with a minimum of statistical jargon. InStat's help screens review the use of each test and explain every portion of the results.
With other statistics software, it is too easy to get the right answer to the wrong question. That's why InStat provides a unique analysis checklist. Double-check that your data have not violated any assumptions of the test, and that you have picked a test that matches your experimental design and really answers the question you had in mind.
Here are some key features of "GraphPad InStat":
■ Column statistics ■ Group comparisons ■ Contingency tables ■ Linear regression and correlation ■ Multiple regression and correlation ■ Up to 1000 rows and 26 columns of data. ■ Mathematically transform selected data (i.e., log, reciprocal, logit, etc.). ■ Transpose rows and columns. ■ Copy results or data to the clipboard, or export as a text file. ■ GraphPad InStat is also able to export graphs as PICT (Mac) files. or Windows Metafile (.WMF), or print graphs on any type of printer. ■ Annotate your data and analyses using a built-in notes editor. ■ InStat files contain analysis choices as well as data so you can quickly rerun the same test with new data. ■ Combine 2 columns (add, subtract, multiply, divide) to create a new column. ■ Import comma or tab delimited files. ■ Import indexed (stacked) data, entire tables or selected rows and columns, filter selected data. ■ Export the data table as a text table, or as indexed (stacked) file. ■ Exclude selected values. They appear on the data table, but are treated as missing values by the analyses.
Limitations:
■ 30 days trial period
GraphPad InStat 3.0
add to watchlist add to download basket send us an update REPORT- runs on:
- Mac OS 8.6 or later / OS X or later (PPC & Intel)
- file size:
- 1.8 MB
- filename:
- InStat3DemoInstaller.dmg
- main category:
- Math/Scientific
- developer:
- visit homepage
Microsoft Teams

ShareX

IrfanView

Context Menu Manager

calibre

Windows Sandbox Launcher

Bitdefender Antivirus Free

4k Video Downloader

Zoom Client

7-Zip

- 4k Video Downloader
- Zoom Client
- 7-Zip
- Microsoft Teams
- ShareX
- IrfanView
- Context Menu Manager
- calibre
- Windows Sandbox Launcher
- Bitdefender Antivirus Free