Softpedia
 

MAC CATEGORIES:


GLOBAL PAGES >>
NEWS ARCHIVE >>
SOFTPEDIA REVIEWS >>
MEET THE EDITORS >>
WEEK'S BEST
  • EarthDesk 5.8.5
  • GraphicConverter 8...
  • MacPorts 2.1.1
  • CCleaner 1.03.131
  • Quicksilver ß68 Bu...
  • TextWrangler 4.0.1...
  • Google Chrome 21.0...
  • Winclone 3.3
  • ScreenFlow 3.0.6
  • Apple Security Upd...
  • Home > Mac > System Utilities
     Report malware

    atMonitor 2.7.1

    Softpedia Pick Award
    Download button

    Downloads: 2,073  Tell us about an update
    User Rating:
    Rated by:
    Very Good (4.0/5)
    2 user(s)
    Developer:

    License / Price:

    Size / OS:

    Binary Format:

    Last Updated:

    Category:
    atPurpose Technologies | More programs
    Donationware / FREE
    1.5 MB / Mac OS X 10.5 or later
    Intel only Intel only
    April 14th, 2012, 03:08 UTC [view history]
    Home / System Utilities

     Read user reviews (0)  Refer to a friend  Subscribe

    atMonitor description

    Free and very powerful process explorer and system monitor utility for your Mac

    atMonitor is a highly advanced system monitoring application for Mac OS X that will allow you to view system activity in real-time.

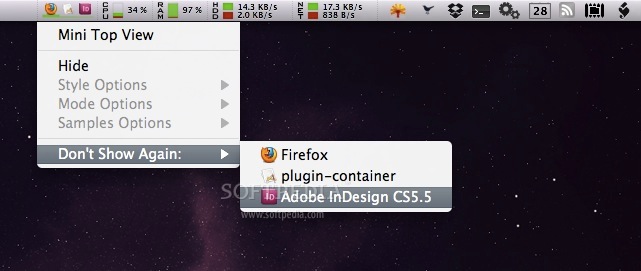
    atMonitor can be displayed in the menu bar, as a stand alone floating window or in the dock icon.

    atMonitor has been designed to allow quick assessment of your Mac's state and it is powerful enough to make it a core utility in anyone's system troubleshooting toolkit.

    atMonitor offers a better alternative to Apple's own "Activity Monitor" and it will combine the best features of many other existing monitoring tools while also adding an extensive list of unique features of its own.

    In addition to the standard CPU, GPU, VRAM, FPS, Disk and Network info, atMonitor allows interaction with processes, setting up triggers, logging, purging RAM and much more.

    Here are some key features of "atMonitor":

    Monitoring:
    · MiniTop - Displays top 3 most CPU hungry applications.
    · CPU - Supports multiple cores. Displays detailed process information and the top 3 CPU intensive processes.
    · RAM - Shows memory specifications and the usage broken down into wired, used and free. It also tracks the top 3 memory hog processes and allows to "Purge" - recover memory (dev tools must be installed for the Purge feature to work).
    · GPU - Supports multiple GPUs. Shows video graphics card brand and the number of contexts and surfaces.
    · Temperature - Both CPU and GPU temperatures are reported.
    · FPS - Monitors the refresh rate of the screen (buffer swaps) and context switches.
    · VRAM - Tracks the memory usage of installed video cards and displays VRAM total, used and free as well as the number of textures.
    · Disk - Displays the read and write performance of the most active disk. All mounted local and network disks are displayed and can be accessed with one click.
    · Network - Displays the read and write performance of the active network interface. Shows the public, private and router IPs as well as the corresponding MAC addresses. Selecting any value will conveniently copy it to the clipboard.

    Top Window:
    · Top Window is the core functionality of atMonitor. It serves multiple purposes and is used for both monitoring and interacting with the system. For each process Top Window displays its PID and path, parent PID and path, description, arguments, environment, libraries and open files.

    Triggers:
    · Triggers can be setup to activate any script when a predefined value reaches its target. For example, a script could be written to email system administrator when the CPU usage goes above 90%. Two sample scripts, one basic and the other one a little bit more advanced using GROWL, are included.

    Utilities:
    · Utilities, accessible from "System Info", are a set of useful and domain specific system commands that can show detailed information about the system such as Kernel State, I/O Registers, Smc Sensors and more.

    · Logging
    · atMonito:r allows to log all monitored values. The logs are saved in XML format with names in ISO 8601 standard and can be used to log and troubleshoot system performance.

    What's New in This Release: [ read full changelog ]

    · [feature] Added 3 new themes: "Pro", "Text" and "Compact" to the menu bar activity viewer in addition to the existing "Developer" theme.
    · [bugfix] More robust VRAM tracking.
    · Many other small bug fixes and improvements.

     Softpedia guarantees that atMonitor 2.7.1 is 100% CLEAN, which means it does not contain any form of malware, including spyware, viruses, trojans and backdoors. [read more >]


    TAGS:

    system monitor | process explorer | activity monitor | monitor | activity | track


    HTML code for linking to this page:


    Go to top

    WindowsGamesDriversMacLinuxScriptsMobileHandheldNews

    SUBMIT PROGRAM   |   ADVERTISE   |   GET HELP   |   SEND US FEEDBACK   |   RSS FEEDS   |   UPDATE YOUR SOFTWARE   |   ROMANIAN FORUM