A versatile cross platform application that enables you to quickly plot images for the latitude-longitude data contained by netCDF datasets. #NetCDF plotter #Data plotter #Plot geographic data #Plot #NetCDF #Slice
Panoply is designed to help you view and process the data included in netCDF, HDF, GRIB, and other types of databases, in order to generate geo-gridded plots. Since the application deploys on the Java Runtime, Panoply can be used on multiple platforms.
Once installed on your Mac, you can use the Panoply application to quickly open database files that have various extensions, such as .nc, .nc4, .grib, .hdf, .hdf4, or .hdf5. Since Panoply quickly integrates into your system, simply double clicking the respective files should do the trick.
Noteworthy is that Panoply also offers you the possibility to browse OpenDAP and THREDDS catalogs available online, and use them as datasets sources.
The Panoply user interface is organized into multiple tabs that help you browse between datasets and catalogues, to adjust the scale range, to customize labels, vectors, to overlay masks, and so on. Finding your way around proves to be fairly intuitive.
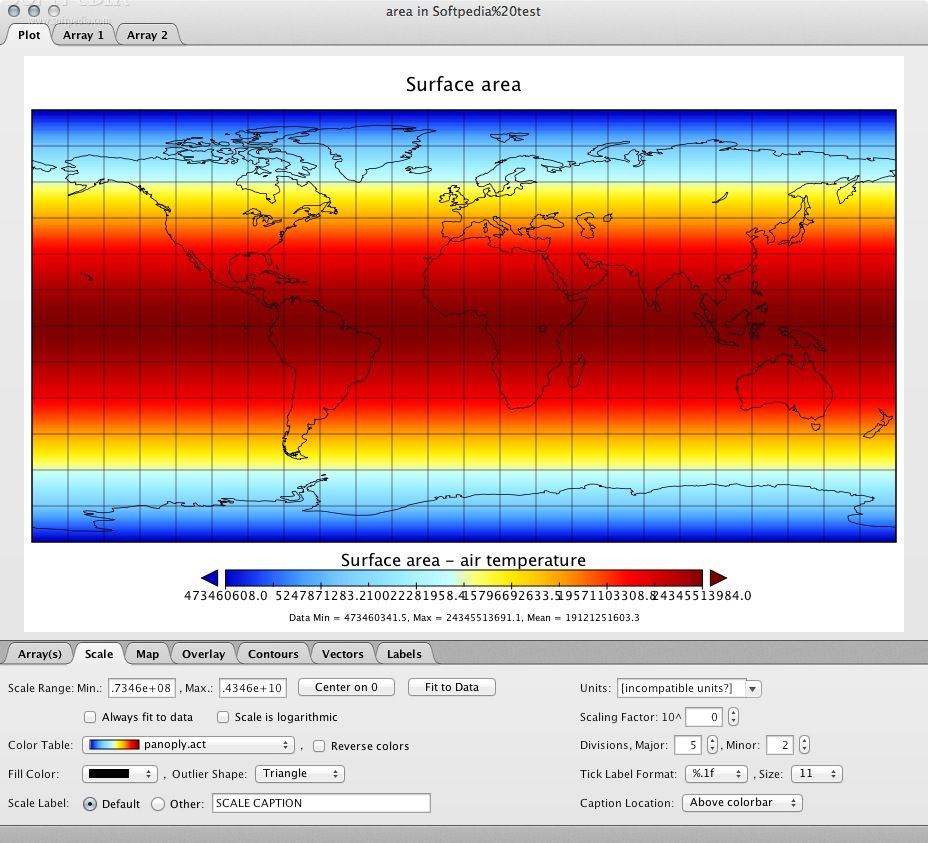
The Panoply application can be used to plot and slice 1D and 2D arrays by using multi-dimensional variables expressed as latitude and longitude data.
The utility can also combine two arrays and can project the analysis using more than 100 maps. What’s more, you get to overlay continent, or other types of masks on top of the generated arrays.
The geo-gridded representation, can be exported to image files (JPG, JPEG, TIFF, or PNG), to PDF documents, to PostScript files, to AVI or MOV animations, or to the KMZ file format.
To conclude, if you need to visualize the information contained by HDF, netCDF, and GRIB datasets, Panoply includes the necessary tools for plotting and slicing the included data, in order to provide and accurate graphic representation.
What's new in Panoply 4.12.6:
- Bugfix: Possibility that 1D data in a file tagged with timeSeries featureType could be mis-identified as 2D.
- Line plots may use indirect time variable as axis.
- Code linting and minor optimizations.
- Library: Updated GISSmap to v. 2.6.2.
Panoply 4.12.6
add to watchlist add to download basket send us an update REPORT- runs on:
- macOS 10.7 or later (Universal Binary)
- file size:
- 38.7 MB
- filename:
- PanoplyMacOS-4.12.6.dmg
- main category:
- Math/Scientific
- developer:
- visit homepage
ShareX

Zoom Client

IrfanView

calibre

Microsoft Teams

Context Menu Manager

Bitdefender Antivirus Free

7-Zip

4k Video Downloader

Windows Sandbox Launcher

- 7-Zip
- 4k Video Downloader
- Windows Sandbox Launcher
- ShareX
- Zoom Client
- IrfanView
- calibre
- Microsoft Teams
- Context Menu Manager
- Bitdefender Antivirus Free