View and analyze LabChart data files.. #View LabChart data #Analyze LabChart data #LabChart data analyzer #LabChart #Analyzer #Viewer
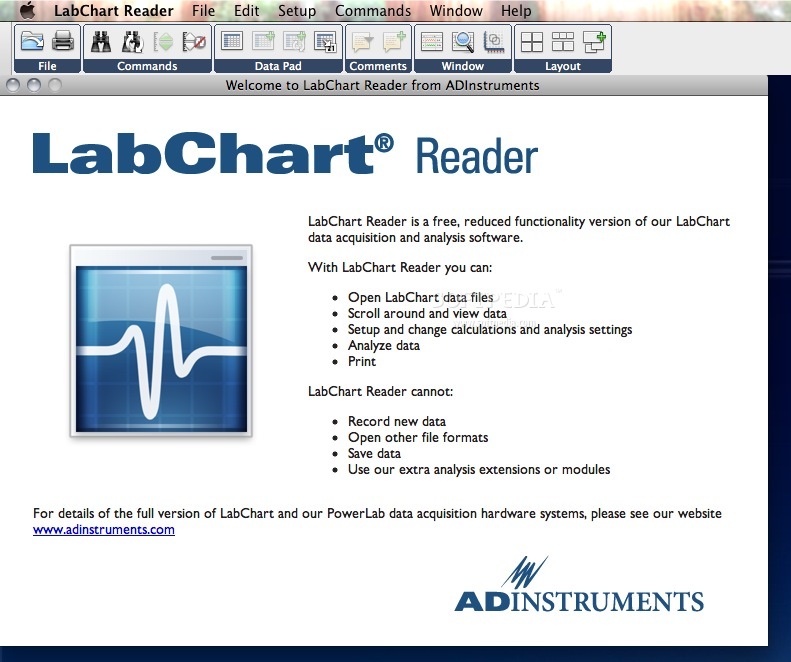
LabChart Reader is a free application for Mac OS X that enables you, your colleagues and students to view and conduct limited analysis of LabChart data files.
LabChart Reader allows you to: · Share data with colleagues around the world for comment and discussion on the results and analysis · Provide research LabChart data for students to view and analyze in the laboratory/classroom · Display and analyze data during research and teaching presentations · Upload data files to websites and allow viewing of your data worldwide
What's new in LabChart Reader 8.1.1:
- LabChart is now compatible with Mac OS X 10.11 El Capitan.
- Improved behavior when deleting pages from the Scope view if the Chart view is closed.
LabChart Reader 8.1.1
add to watchlist add to download basket send us an update REPORT- runs on:
- Mac OS X 10.6 or later (Intel only)
- file size:
- 32.4 MB
- filename:
- LabChartReader_8.1.1.pkg
4 screenshots:
- main category:
- Math/Scientific
- developer:
- visit homepage
ShareX
Capture your screen, create GIFs, and record videos through this versatile solution that includes various other amenities: an OCR scanner, image uploader, URL shortener, and much more

4k Video Downloader
Export your favorite YouTube videos and playlists with this intuitive, lightweight program, built to facilitate downloading clips from the popular website

7-Zip
An intuitive application with a very good compression ratio that can help you not only create and extract archives, but also test them for errors

calibre
Effortlessly keep your e-book library thoroughly organized with the help of the numerous features offered by this efficient and capable manager

IrfanView
With support for a long list of plugins, this minimalistic utility helps you view images, as well as edit and convert them using a built-in batch mode

Microsoft Teams
Effortlessly chat, collaborate on projects, and transfer files within a business-like environment by employing this Microsoft-vetted application

Zoom Client
The official desktop client for Zoom, the popular video conferencing and collaboration tool used by millions of people worldwide

Windows Sandbox Launcher
Set up the Windows Sandbox parameters to your specific requirements, with this dedicated launcher that features advanced parametrization

Bitdefender Antivirus Free
Feather-light and free antivirus solution from renowned developer that keeps the PC protected at all times from malware without requiring user configuration

Context Menu Manager
Customize Windows’ original right-click context menu using this free, portable and open-source utility meant to enhance your workflow

% discount
Windows Sandbox Launcher
- Windows Sandbox Launcher
- Bitdefender Antivirus Free
- Context Menu Manager
- ShareX
- 4k Video Downloader
- 7-Zip
- calibre
- IrfanView
- Microsoft Teams
- Zoom Client
essentials
Click to load comments
This enables Disqus, Inc. to process some of your data. Disqus privacy policy