A reliable and intuitive strip chart macOS application designed to help you view and analyze various types of signals in real-time. #Data aquisition #DAQ software #Realtime sensors #Sensor #Acquisition #DAQ
Plotting electrical signals in real-time can prove to be a little tricky but the DAQ Plot app will help you get the job done, while also giving you the ability to control devices in using digital output channels.
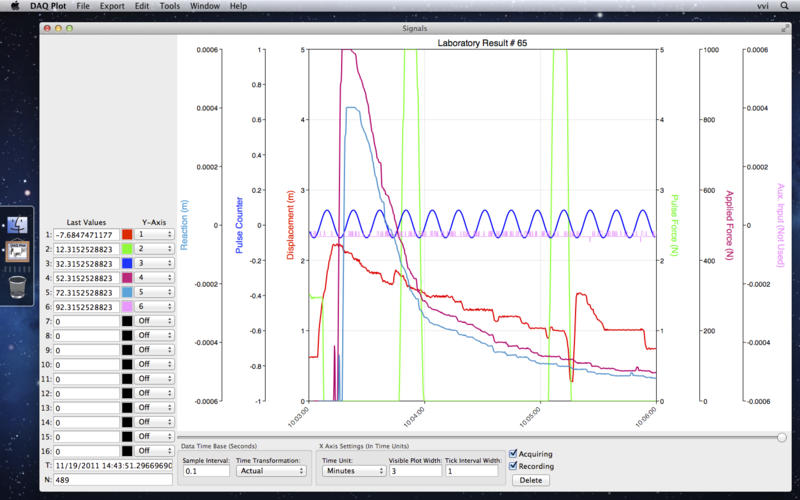
DAQ Plot's interface is basic and helps you to view the graph, analyze it and change the values for each selected axis. You can alter the sample interval as well as modify the transformation methods, according to your needs.
You can access a Spectra window for the circuit, and you can also enable or disable some of the elements, depending on your needs.
What's more, the DAQ Plot app provides you with complete control over switches and valves, making it a lot easier to command the process. Of course, you can view the effects of any changes you made with the help of the real-time strip chart and this enables you to monitor the process and see if there are any differences.
Also, DAQ Plot brings you multiple signal types and allows you to easily alter the way signal is displayed by adding a large number of effects and signal values, which can be exported in multiple ways.
Moreover, DAQ Plot comes with a modular design that was specifically created in order to provide you with ease of use and scalability in order to help you get the job done as fast as possible, without any type of hassle.
DAQ Plot also features multiple tutorials and sample material that you can use in order to get started and it also make it simple to learn where to get the hardware, how to install drivers and it even provides you with the means to analyze your charts.
In conclusion, DAQ Plot apart from helping you analyze and view electric signals in real-time, it will also make it simple and straightforward to make as many modifications to the current project as you need.
What's new in DAQ Plot 12.15.8:
- This version speeds up launching, fixes bugs and removes API associated with security concerns and replaces those calls with compile-time deterministic implementations.
DAQ Plot 12.15.8
add to watchlist add to download basket send us an update REPORT- runs on:
- macOS 10.11 or later (-)
- file size:
- 14.9 MB
- main category:
- Math/Scientific
- developer:
- visit homepage
calibre

7-Zip

IrfanView

Bitdefender Antivirus Free

paint.net

Zoom Client

Windows Sandbox Launcher

4k Video Downloader

ShareX

Microsoft Teams

- 4k Video Downloader
- ShareX
- Microsoft Teams
- calibre
- 7-Zip
- IrfanView
- Bitdefender Antivirus Free
- paint.net
- Zoom Client
- Windows Sandbox Launcher