A cross-platform, reliable application that will allow Java developers to quickly profile their Java based projects from their desktop. #Java profiler #Find memory leak #Resolve threading issue #Profiler #Analyze #Java
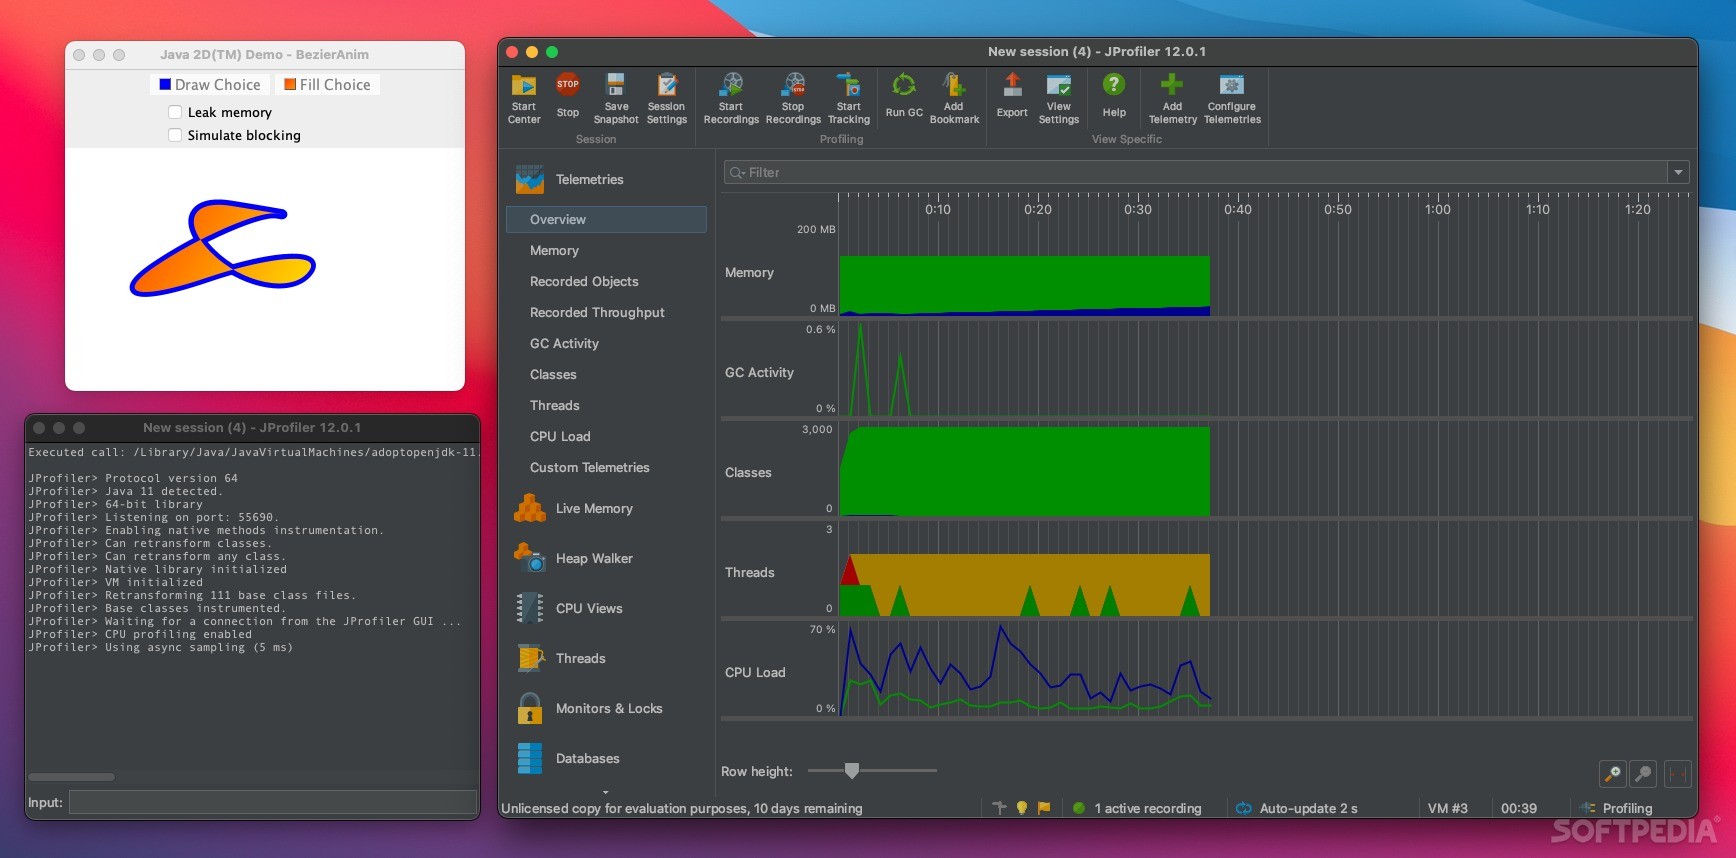
JProfiler is a user friendly Java profiling application that comes with an intuitive graphical interface, can deal with offline or remote sessions, and enables you to compare snapshots.
The Request Tracking feature provides support for profiling parallel and multi-threaded projects.
Right off the bat, you can connect the JProfiler application with your IDE in order to be able to profile local sessions without having to deal with the session configuration. The developers provide integration plug-ins for 4 popular IDEs: Eclipse, IntelliJ IDEA, NetBeans, and Oracle JDeveloper.
JProfiler comes with various integration wizards for application servers that will help you profile Java apps over the network. What’s more, JProfiler also includes offline profiling capabilities: it can use the trigger system to handle the profiling, and the resulted snapshots will be saved to the disk.
Lastly, the JProfiler utility also offers you the possibility to quickly compare multiple snapshots, and can highlight the changes. The comparison results can then be organized and exported to reports, and you can easily analyze them at a later time.
JProfiler enables you to quickly define your own probes that will be deployed to the profiled application via the utility’s user interface, without requiring restart. Since JProfiler monitors all your database connections, you can use these tools to identify the code that triggers slow responses.
Moreover, the JProfiler command line tools and the snapshot comparison functionalities, make the app very useful during the development process. It can also be used by QA teams to track the progress, or to identify problems.
JProfiler provides a collection of powerful Java profiling tools that can help you analyze local or remote sessions, database connection, to run custom probes, and so on.
What's new in JProfiler 14.0.2:
- New features:
- Full support for Java 22 virtual threads
- Support for virtual threads in HPROF snapshots
JProfiler 14.0.2
add to watchlist add to download basket send us an update REPORT- runs on:
- macOS 10.11 or later (Universal Binary)
- file size:
- 161.9 MB
- filename:
- jprofiler_macos_14_0_2.dmg
- main category:
- Developer Tools
- developer:
- visit homepage
7-Zip

Windows Sandbox Launcher

paint.net

IrfanView

Bitdefender Antivirus Free

Zoom Client

Microsoft Teams

ShareX

4k Video Downloader

calibre

- ShareX
- 4k Video Downloader
- calibre
- 7-Zip
- Windows Sandbox Launcher
- paint.net
- IrfanView
- Bitdefender Antivirus Free
- Zoom Client
- Microsoft Teams